
In reporting published on November 20, 2026, at 03:08 UTC+8, Bitcoin was trading around $62,640 on Thursday in U.S. time, down 0.6% on the day and roughly 28% below its late-September peak near $87,000. The decline continued despite a strong stock-market debut for Anthropic.
Anthropic priced 980 million shares at $83, raising $81.34 billion, and began trading on Nasdaq under ANT. Its shares opened at $111.50, up 34%, and briefly took the Claude maker’s market value above $2 trillion, Decrypt reported. The enthusiasm did not extend across the market: by 12:18 p.m. ET, the Nasdaq Composite was down 1.55%, the S&P 500 was down 1.59%, and the Dow was down 2.03%. Investors remained concerned about the cost of AI infrastructure and whether that spending would deliver adequate returns.
Bitcoin’s weakness began before the listing. U.S. spot Bitcoin ETFs had seen roughly $2.9 billion in outflows that month, including $306.4 million on Wednesday, amid rising Treasury yields and expectations of further Federal Reserve rate hikes. Some traders argued that the IPO diverted capital from crypto, but the report said that claim was unproven. Bitcoin and AI stocks had both declined, pointing to a broader retreat from risk rather than establishing a direct shift into Anthropic shares.
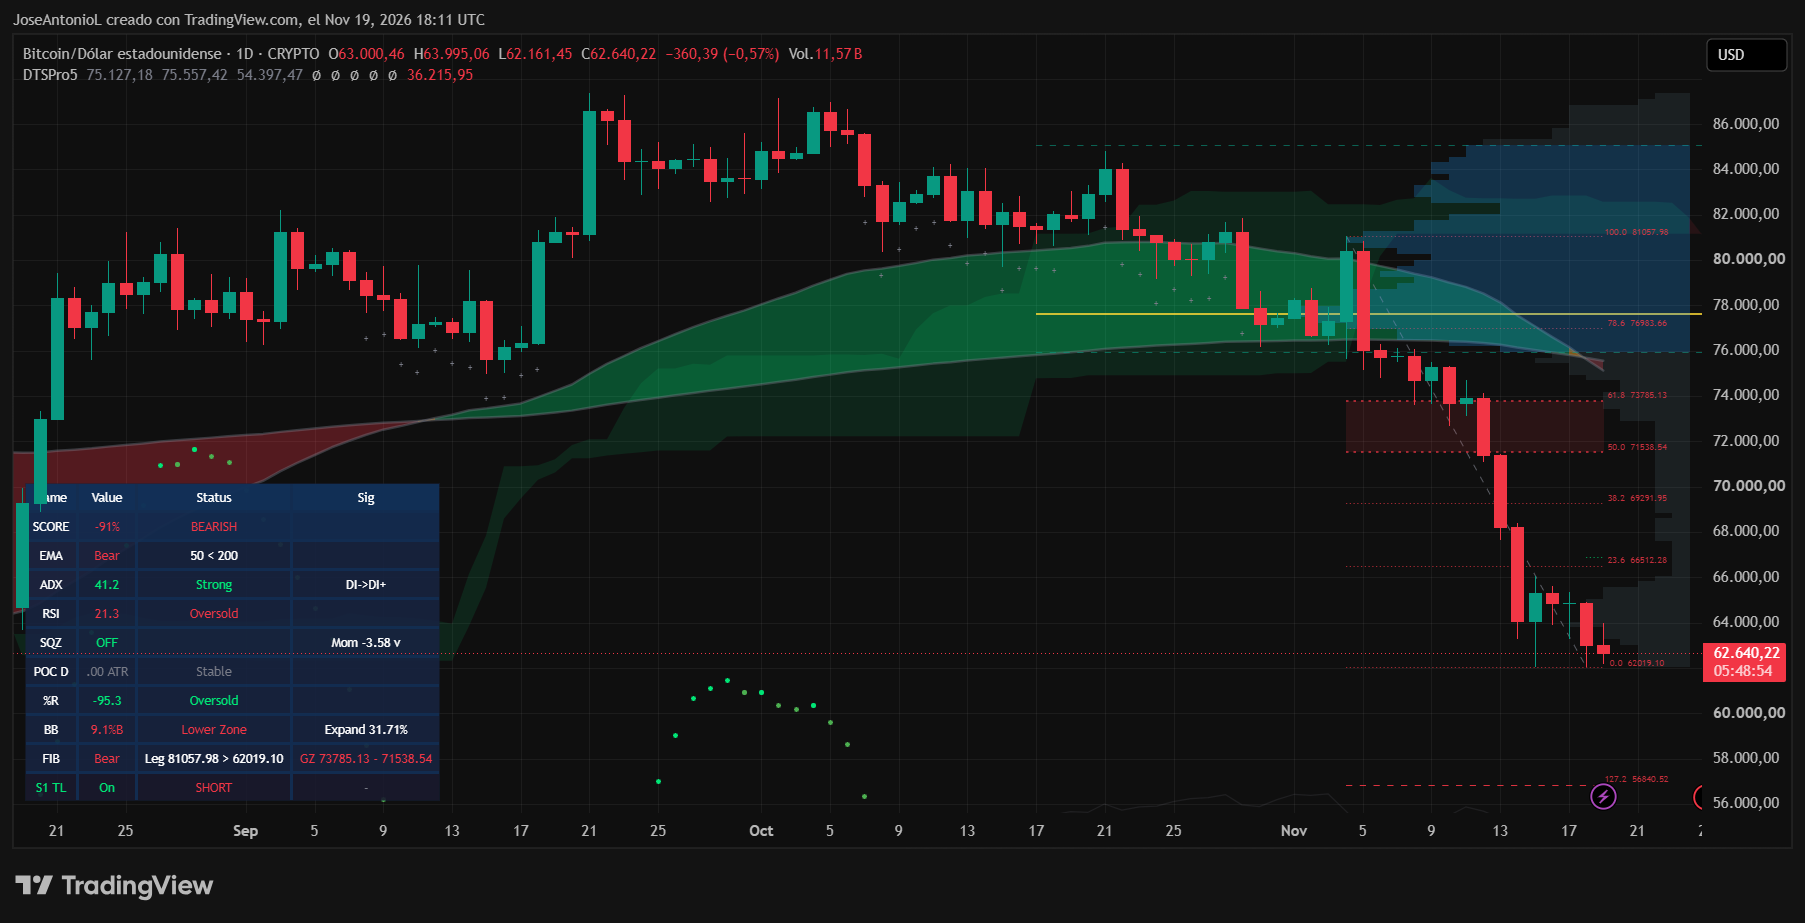
What the Bitcoin chart showed
Bitcoin was below its 50-day and 200-day exponential moving averages, with the shorter average beneath the longer one. The report said that EMA-based death cross was confirmed Thursday. It differs from the traditional death cross, which uses simple moving averages.
The relative strength index stood at 21.3, below the 30 level commonly associated with oversold conditions. That leaves room for a rebound but does not mean one must follow. The average directional index was 41.2, above the 25 level generally associated with a strong trend; with the negative directional indicator above the positive one, the chart showed sellers in control.
The chart placed immediate support near $62,019. A decisive daily close below it could bring $60,000, then a Fibonacci extension near $56,841, into focus. For a recovery, Bitcoin would first need to reclaim $66,512, with resistance around $69,292 and $71,539, followed by tougher tests at $73,785 and $76,984. Those are chart levels, not forecasts.